Wednesday, February 24, 2016

Simple functions sometimes have the most value: An interview with Peter Traverse


“Sometimes the simple functions have the most value”. If you ask Peter Traverse, a mO power user, what he does he says, "I'm just a farmer.” In talking with him and watching how easily he navigates through the myObservatory environment you quickly realize that he is far more than “just” anything. Peter Traverse is a regenerative agriculture practitioner and entrepreneur. Clients hire him to do agricultural planning for their farms. They rely on his understanding of the complexities of farming paired with his experience in business planning and management. He grew up on a farm in Vermont and integrates that knowledge with modern technology and innovative agricultural practices. He has been working with myObservatory since the beginning and is still involved in product development. For this interview we focused on one question:

“What features do you use most in myObservatory for agricultural planning?”

As Peter describes, myObservatory is a powerful platform for experiencing and learning about geospatial data. Here is a typical working stream of how Peter uses mO. First, he navigates to a county GIS website and selects layers to download i.e. parcel data. This parcel data comes as a shapefile with metadata and attributes attached to each parcel polygon. Information in these parcels differs by county but most often includes tax ID number, assessment value, owner name and address, and ALWAYS land area (in acres).


Peter uses this information to help him create land management plans. Once he downloads the layers from the county he uploads them into myObservatory using the Upload tool. Then he uses Manage myObservatory Data to organize the data layers in the map legend into folders. Other layers he commonly uses for land planning are four foot elevation maps. These maps, created using Lidar (http://lidar.cr.usgs.gov/), have a high level of accuracy. He uses the contour lines on the elevation map to draw out keylines. A keyline is a line segment that follows the contour line from an inflection point in a valley out to the side of a slope. The concept behind keyline plowing is based on the cohesion and adhesion properties of water. By subsurface plowing up and downhill parallel to a keyline the water moves from the valleys to the ridges. This is especially useful in areas that have low precipitation and/or soil types that do not absorb water well. The hot dry summers and red clay of Virginia are a perfect match for keyline plowing.

Once Peter draws the keyline in myObservatory he then creates a geospatial pdf file to export. This file can be read by a third party app that uses it as a georeferenced base map. With very few steps, Peter is able to take a drawing from myObservatory out into the field and walk or plow the exact keyline that he made. Another feature that Peter uses frequently is the Hand Drawn Shapes tool. He uses this tool to draw line and polygon layers right into myObservatory. This is useful for planning in many ways. It helps provide land area for rotational grazing matrices. It even helps quickly determine how much material to order for fencing projects. Instead of having to go out into the pasture to walk the entire length of the fence Peter is able to use the Measuring tool to gauge the length of fence to be created or repaired. The grazing polygons are also a useful place to store data about that specific place i.e. soil data. The Field Photo Journal function allows Peter to track herd movements, grazing conditions and browse observations and store this data with the field polygon. The power of being able to draw in myObservatory exactly where cattle will be pastured is a compelling reason for any land manager to use myObservatory.


When I asked Peter what his most important message was for readers he responded as an educator might. “I want people to be able to explore public data, explore their place.” We agree that by providing the public with a means to examine their own data that the possibilities are endless.
 If you are a landowner interested in what myObservatory has to offer for you and your land please visit our website and check us out! myObservatory

Friday, February 19, 2016

Open Source Based Monitoring of Urban Areas


Robert Schima1, Tobias Goblirsch2, Christoph Salbach3, Bogdan Francyk2, Jan Bumberger1 and Peter Dietrich1
1 UFZ – Helmholtz Centre for Environmental Research, Department Monitoring and Exploration Technologies, robert.schima@ufz.de
2 University of Leipzig, Faculty of Economics and Management, Information Systems Institute, tobias.goblirsch@uni-leipzig.de

3UFZ - Helmholtz Centre for Environmental Research, Department of Computational Landscape Ecology, Leipzig, Germany, christoph.salbach@ufz.de

Motivation

The impact of global change, urbanization and complex interactions between humans and the environment show different effects on different scales. However, the desire to obtain a better understanding of ecosystems and process dynamics in nature accentuates the need for observing these processes in higher temporal and spatial resolutions. Especially with regard to the process dynamics and heterogeneity of urban areas, a comprehensive monitoring of these effects remains to be a challenging issue in the field of environmental research.

Mobile Sensor Integration Platform


Open source based electronics and cost-effective sensors are offering a promising approach to explore new possibilities of mobile data acquisition and innovative strategies and thereby support a comprehensive ad-hoc monitoring and the capturing of environmental processes close to real time. Accordingly, our project aims the development of new strategies for mobile data acquisition and real-time processing of user-specific environmental data, based on a holistic and integrated process. To this end, the concept of our monitoring system covers the data collection, data processing and data integration as well as the data provision within one infrastructure. This ensures a consistent data stream and a rapid data processing. However, the overarching goal is the provision of an integrated service instead of lengthy and arduous data acquisition by hand. Therefore, the system also serves as a data acquisition assistant and gives guidance during the measurements.


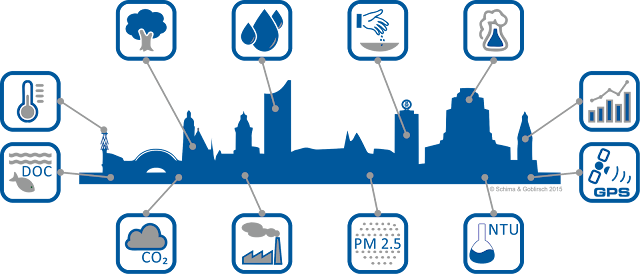
Figure 1: Basic idea of an holistic monitoring of urban areas leading into an interactive service oriented data store of gathered information.

Hands-on Approach

In technical terms, our monitoring system consists of mobile sensor devices, which can be controlled and managed by a smart phone app (Android). At the moment, the system is able to acquire temperature and humidity in space (GPS) and time (real-time clock) as a built in function. In addition, larger system functionality can be accomplished by adding further sensors for the detection of e.g. fine dust, methane or dissolved organic compounds. From the IT point of view, the system includes a smart phone app for initial data processing, data provision and data visualization. Furthermore, the smart phone app provides an interface to the powerful engine of myObservatory. Here, the user has full access to all the data managing and analysis tools provided by myObservatory. Environmental monitoring and data evaluation have never been more exiting. Feel free to contact us for more information or additional notes.

Figure 2: The whole system is constructed in a modular way. Little adjustments can be done easily and even under field conditions.

Initial Field Experiments

In September 2015, an initial city monitoring based on the mobile monitoring platform was performed by five independently driving cyclists through the city center of Leipzig (Germany). 

Figure 3: The figure shows the prototype of the sensor integration platform fixed to a bike rack, ready for an ad-hoc urban monitoring.

As a result we were able to instantly show a heat and humidity map of the inner city center as well as an exposure map for each cyclist. This emphasizes the feasibility and high potential of open source based monitoring approaches for future investigation in the field of urban area monitoring, environmental research, citizen science or the validation of remote sensing data. Below you can see an example of the data gathered by the mobile sensor integration platform presented and analyzed by using the tools of myObservatory. Thanks to myObservatory, environmental data acquisition and evaluation - easy as pie.


Figure 4: Urban Monitoring by bike. Sampling points of temperature and humidity measurement based on the mobile sensor integration platform.


Figure 5: Urban Monitoring by bike. Evaluation of urban heat conditions based on the mobile sensor integration platform.

To sum-up:


Figure 6: Overview of the mobile open source based sensor platform.


Wednesday, February 10, 2016

Projeto Rios, a partner project of myObservatory

Citizen science is increasingly being recognized as an important new component of environmental monitoring and Projeto Rios (www.projectorios.org) is a project that aims to respond to the lack of an effective involvement of citizens in the problems concerning the deterioration of rivers water bodies ecological status.

The project results from Projecte Rius, launched in Catalonia by "Associació Habitat for Projecte RIUS Catalunya" in 1997 and, through a protocol established between the Portuguese Association of Environmental Education (www.aspea.org) and the "Associació Hàbitats for Projecte RIUS Catalunya", was extended to the Portuguese territory in 2006. All interested in being volunteers and actively participate in the national network of Projeto Rios must fill an application form identifying the responsible for the group and the river stretch to adopt. All stakeholders can sign up and participate actively in Projeto Rios: schools, associations, private and public companies, municipalities, scouts groups, third age homes, NGO’s, groups of friends and families.

Using an experimental scientific method to collect and record environmental data, the groups of Projeto Rios implement an adoption plan of a river stretch of 500 meters that include monitoring activities. Thus, the project pretends to promote a scientific curiosity and an affection for river ecosystems that would lead to a conscious change in the citizens behavior and, consequently, contribute to enrich the knowledge about the river bed and embankments and to eventually support decision making processes with the objective to improve the overall river ecologic status.

The project provides kits financed by the patrons, which contain files and tools to facilitate the interpretation of fauna, flora and field forms for recording the data of the river ecosystem. These field forms were, so far, available only on paper and did not allow, for that reason, the application of a mechanism to collect and centralize digital data generated by field trips.


The first field visit marks the start of the group activity and, being the first contact with the river stretch, aims to take stock of its main dysfunctions and status, taking into account accessibility and security issues, the monitoring points where, in all future field trips, the monitoring measures will be carried out. During this first approach, the group fills the first field visit form to systematize the knowledge and the needs assessment and thus prepare the subsequent field trips.


After a diagnosis, field visits start to take a much more detailed approach incorporating the analysis of biological, physical-chemical, hydromorphological parameters, biodiversity and data on land use, traditions and cultural and built heritage. Groups should make a minimum of two annual field visits (preferably in spring and autumn).


The key for a continued citizen involvement is the availability of detailed, relevant and understandable information. Therefore, having myObservatory as a partner, Projeto Rios has managed the developing of the “mO4Rivers” Web Mobile App in order to support a simple and quick data submission process conducting to an easy share of the information and of the knowledge obtained from data analytics processes. The need to develop “mO4Rivers” arises from the difficulties to collect and submit the data and processing it. The centralization of data using the App and myObservatory features will allow the volunteers and managers of the project disseminating the knowledge acquired and to encourage the adoption of more rivers. This will also allow the use of these datasets by researchers, teachers and authorities in an easy, georeferenced and documented way. More about the "mO4Rivers" Web Mobile App in a next post.